The formatting of the blog posting may be odd if you are reading this in a Feed Reader or via e-mail distribution, so click on the title above (which is an active link) to view the website version.
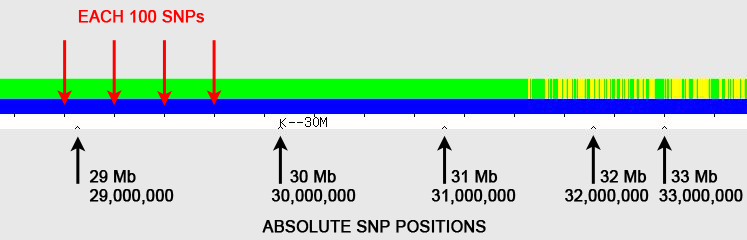
FIGURE 1: Two Types of Tick Marks on GEDmatch One-to-One Comparison
Question: How do you obtain the boundaries of FIRs (fully-identical regions) on GEDmatch?
Answer: Using the little "inverted V" tick marks on the one-to-one tool graphic (see Figure 1).
The red arrows point to regularly spaced tick marks, which identify every 100 SNPs (single nucleotide polymorphisms). The black arrows point to irregularly spaced "inverted V" tick marks; these show the absolute SNP positions and are spaced at 1 Mb (1,000,000) intervals, with labels every 10 Mb (10,000,000) – in the example here, the label "K--30M" represents SNP position 30 Mb (30,000,000). [Someone has pointed out that the "K" on GEDmatch is actually a vertical line with left-pointing arrow (<--), which I agree is almost certainly the case, but I've continued to use "K" in this blog posting as it is simplistically descriptive.]
Follow-up Question: But where are the little tick marks?
First a few abbreviations, definitions, and explanations:
HIR: Half-identical region (see Here for information on the ISOGG wiki), where the alleles are matching along a stretch of DNA on either the maternal or paternal chromosome – this is the typical type of matching seen.
FIR: Fully-identical region (see Here for information on the ISOGG wiki), where the alleles are matching along a stretch of DNA on both the maternal and paternal chromosomes – seen when comparing full siblings and double 1st cousins (who also have HIRs).
SNP: Single nucleotide polymorphism (see Here for information on the ISOGG wiki)
The one-to-one tool on GEDmatch is an essential tool. Examples of one-to-one comparisons for both full and half siblings (for Chromosomes 1-6) using the default settings on GEDmatch are shown in Figure 2 (graphics with the corresponding tables below). Note the key (in the center, below the graphics) for the colors of the bars, which shows that the long green bars represent FIRs – seen when comparing full- but not half-siblings – and the long blue bars (the start and end positions for these are shown in the tables) represent any matching segments >7 cM (which is the default cM and includes both HIRs and FIRs). However, the start and end positions of the FIRs are not shown by GEDmatch or by any of the testing companies.
David Pike has a number of free DNA tools, including Search for Shared DNA Segments in Two Raw Data Files, which will give the start and end locations for both HIRs and FIRs, but you need to have access to the raw data files from both individuals to run this. However, by using the "inverted V" tickmarks on GEDmatch, it is quick to make a pretty good estimate of the start and end positions of the FIRs, although you have to check each one individually.
David Pike has a number of free DNA tools, including Search for Shared DNA Segments in Two Raw Data Files, which will give the start and end locations for both HIRs and FIRs, but you need to have access to the raw data files from both individuals to run this. However, by using the "inverted V" tickmarks on GEDmatch, it is quick to make a pretty good estimate of the start and end positions of the FIRs, although you have to check each one individually.
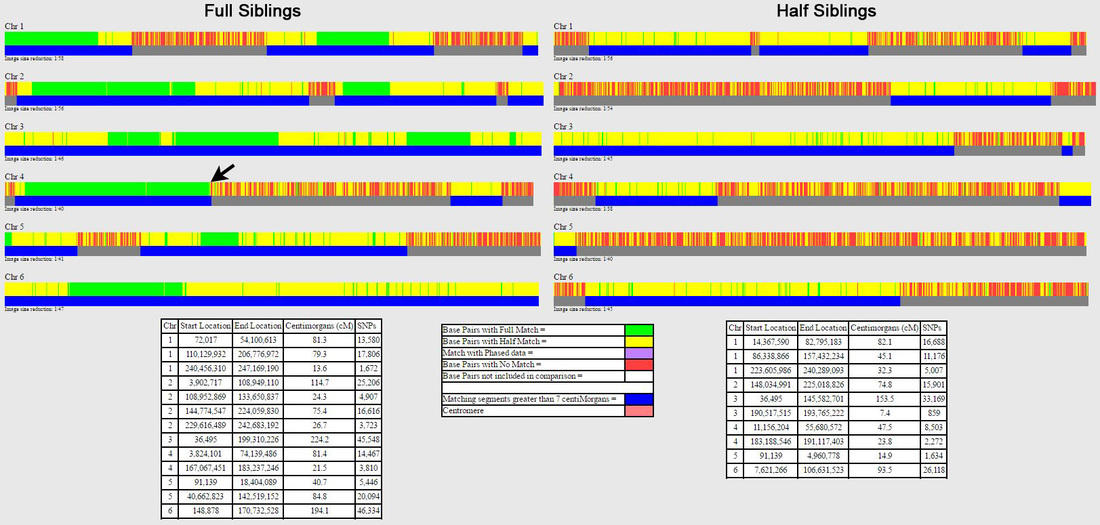
FIGURE 2: One-to-One Comparisons for Full and Half Siblings (Chromosomes 1-6)
Figure 3 shows the standard one-to-one comparison graphic for one of the chromosomes (Chromosome 11) for a pair of full siblings, using GEDmatch's defaults, annotated to identify the FIRs and HIRs. The table at the top left in this figure shows the start and end locations for the 2 matching blue segments (between the circled 1 and 2, and between the circled 3 and 9), but not the limits for the FIRs (the green bars between circled 4-5, 6-7, and 8-9). This default graphic doesn't show the "little tick marks" seen in Figure 1.
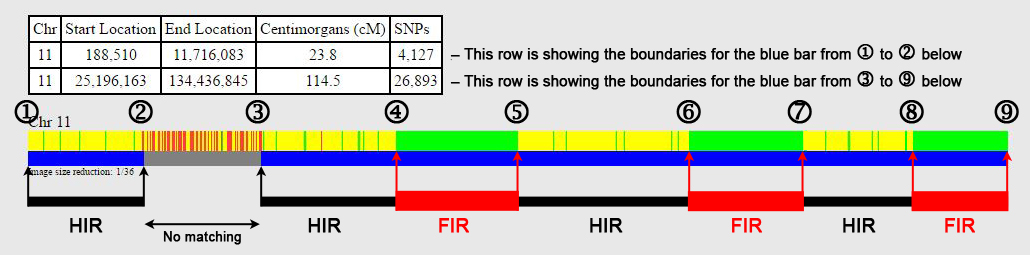
FIGURE 3: One-to-one Comparison for Chromosome 11 (GEDmatch defaults) for Full Siblings annotated to show HIRs and FIRs
To see the little tick marks, change the default width in pixels for the graphic from the default of 1000 to 0 (zero) on the one-to-one comparison entry form, which will show the expanded graphic, as indicated in Figure 4.

FIGURE 4: One-to-One Comparison Entry Form Settings for Expanded View
Figure 5 shows the expanded view of Chromosome 11, with the circled 4 showing the corresponding HIR/FIR junction as in Figure 3. Note that the GEDmatch labels (every 10 Mb for the "inverted V" tick marks) line up with the "K" – as shown by the blue arrow below (for "K--50M" = 50 Mb = 50,000,000). In Figure 1, it is much easier to see which inverted V tick mark lines up with the label "K--30M" (30 Mb = position 30,000,000), as the inverted V's are more spaced out.
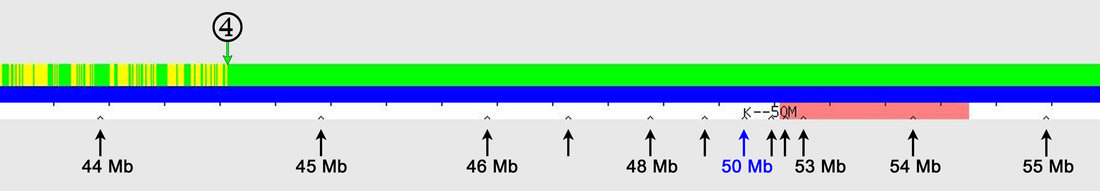
FIGURE 5: Expanded view of Chromosome 11 showing the Tick Marks. The circled "4" matches that in Figure 3.
Using the expanded graphic in Figure 5, I estimated that the start of the FIR region (circled 4) is at position 44.6 Mb (44,600,000). Based on David Pike's Search for Shared DNA Segments in Two Raw Data Files tool, the start of the FIR is 44,649,231, so my estimate is not as precise, but is close enough for most purposes. [The pink bar in Figure 5 represents the centromere – also shown in the key in Figure 2.]
The expanded view is also useful for evaluating the position of (almost) coincidental hidden crossovers in siblings, where a matching segment is far too short to be shown as matching (on either GEDmatch or using David Pike's tool – not shown here), or where the matching segment appears to go directly from a FIR to a non-matching segment (without an intervening HIR), which is a different example of an (almost) coincidental crossover. The latter is shown by the black arrow for full siblings in Figure 2, which has been enlarged in the top panel of Figure 6 – the lower panel shows the expanded view, where it can be seen that there is actually a short HIR between the green FIR and the non-matching segment, which isn't apparent on the default one-to-one graphic. The one-to-one comparisons in Figure 6 are for my mother and her sister (her full sibling), and because I've done a lot of chromosome mapping, I've worked out that my aunt inherited a paternal crossover at ~73.8 Mb and a maternal crossover at ~74.1 Mb, which are almost coincidental.
The expanded view is also useful for evaluating the position of (almost) coincidental hidden crossovers in siblings, where a matching segment is far too short to be shown as matching (on either GEDmatch or using David Pike's tool – not shown here), or where the matching segment appears to go directly from a FIR to a non-matching segment (without an intervening HIR), which is a different example of an (almost) coincidental crossover. The latter is shown by the black arrow for full siblings in Figure 2, which has been enlarged in the top panel of Figure 6 – the lower panel shows the expanded view, where it can be seen that there is actually a short HIR between the green FIR and the non-matching segment, which isn't apparent on the default one-to-one graphic. The one-to-one comparisons in Figure 6 are for my mother and her sister (her full sibling), and because I've done a lot of chromosome mapping, I've worked out that my aunt inherited a paternal crossover at ~73.8 Mb and a maternal crossover at ~74.1 Mb, which are almost coincidental.
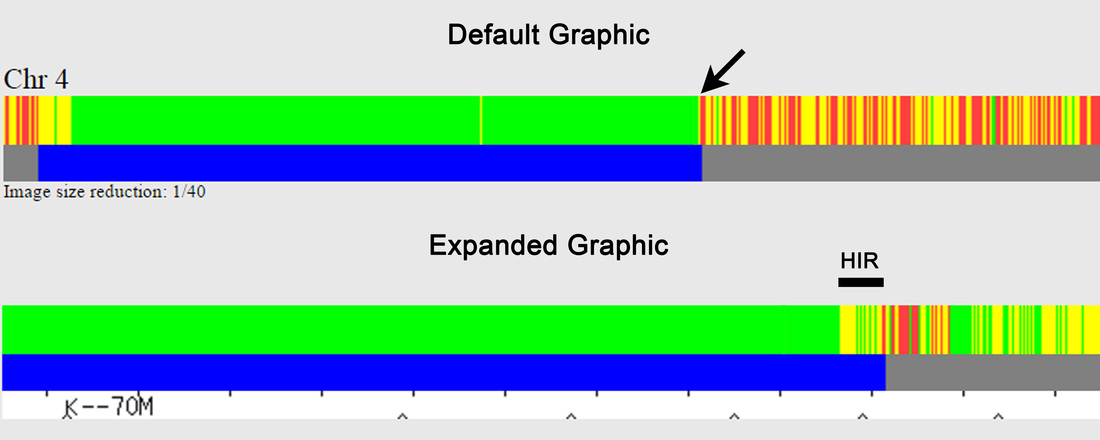
FIGURE 6: Default and Expanded Graphics of One-to-One Comparisons showing Almost Coincidental Crossovers
So if you haven't used the expanded view for one-to-one comparisons, give it a try when appropriate. GEDmatch has many hidden gems, some of which aren't immediately apparent.
Lastly, although most of the tools on GEDmatch are free, don't forget that it is not a commercial enterprise and relies on donations for server and other costs. Please consider a donation via Paypal – there is a link at the bottom of your Home page. Donating helps all of us, as it enables GEDmatch to enhance what they can offer.
Lastly, although most of the tools on GEDmatch are free, don't forget that it is not a commercial enterprise and relies on donations for server and other costs. Please consider a donation via Paypal – there is a link at the bottom of your Home page. Donating helps all of us, as it enables GEDmatch to enhance what they can offer.


